Quelques commentaires sur le rapport du GIEC 2013.
WORKING GROUP I CONTRIBUTION TO THE IPCC FIFTH ASSESSMENT REPORT
CLIMATE CHANGE 2013: THE PHYSICAL SCIENCE BASIS
Final Draft Underlying Scientific-Technical Assessment
Technical sumary
P 5 et suite
“Despite the robust multi-decadal timescale warming, there exists substantial interannual to decadal variability in the rate of warming, with several periods exhibiting weaker trends (including the warming hiatus since 1998) (Figure TS.1). Although the trend uncertainty is large for short records, the rate of warming over the past 15 years (1998–2012; 0.05°C per decade [–0.05 to +0.15]) is smaller than the trend since 1951 (1951–2012; 0.12°C per decade [0.08 to 0.14])”
Donc le réchauffement s’est ralenti récemment.
It is unlikely that any uncorrected urban heat-island effects and land use change effects have raised the estimated centennial globally averaged land surface air temperature trends by more than 10% of the reported trend. This is an average value; in some regions that have rapidly developed urban heat island and land use change impacts on regional trends may be substantially larger
Donc, il y a une réalité des “ilots urbains” qui peuvent localement créer une augmentation plus importante. Le rapport estime que cela a peu de probabilité d’avoir un effet supérieur à 10% sur la moyenne globale (car cela a été corrigé).
There is high confidence that annual mean surface warming since the 20th century has reversed long-term cooling trends of the past 5,000 years in mid-to-high latitudes of the Northern Hemisphere. For average annual Northern Hemisphere temperatures, the period 1983–2012 was very likely the warmest 30-year period of the last 800 years (high confidence) and likely the warmest 30-year period of the last 1400 years (medium confidence).
Continental-scale surface temperature reconstructions show, with high confidence, multidecadal intervals during the Medieval ClimateAnomaly (950 to 1250) that were in some regions as warm as in the mid-20th century and in others as warm as in the late 20th century
Donc il fait plutôt chaud actuellement. Mais on en est pas à des pics de chaleur inconnus depuis des temps immémoriaux.

Figure TS 1 P 84.
Cela s’étend de 1850 à 2010 (bizarrement, il est très difficile de lire les années). En pratique, on voit bien le ralentissement du réchauffement.
Chapitre 1 : introduction (à partir de la page 131)
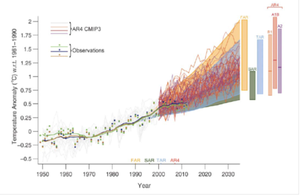
Figure 1.4 (p17: Estimated changes in the observed globally and annually averaged surface temperature anomaly relative to 1961–1990 (in C) since 1950 compared with the range of projections from the previous IPCC assessments. Values are harmonized to start from the same value in 1990.
Observed global annual mean surface air temperature anomaly, relative to 1961–1990, is shown as squares and smoothed time series as solid lines (NASA (dark blue), NOAA (warmmustard), and the UK Hadley Centre (bright green) reanalyses).
The coloured shading shows the projected range of global annual mean surface air temperature change from 1990 to 2035 for models used in FAR (Figure 6.11 in Bretherton et al., 1990), SAR (Figure 19 in the TS of IPCC, 1996), TAR (full range of TAR Figure 9.13(b) in Cubasch et al., 2001).
For the AR4 results are presented as single model runs of the CMIP3 ensemble for the historical period from 1950 to 2000 (light grey lines) and for three scenarios (A2, A1B and B1) from 2001 to 2035.
The bars at the right hand side of the graph show the full range given for 2035 for each assessment report.
Le graphe est peu lisible. Mais il apparait assez clairement que les modèles (qui sont la base unique de l’alarmisme) surestiment systématiquement la température par rapport à la réalité et que celle-ci est tout proche de sortir de l’intervalle de confiance de ceux-là. Bref, les modèles ne fonctionnent pas !
Chapitre 2 : observation atmosphère et surface (à partir de la page 193)
Il y a beaucoup de parties. Je ne retiens que celles qui relèvent de la météo usuelle et qui font souvent l’objet d’affirmations alarmistes
It is certain that Global Mean Surface Temperature has increased since the late 19th century. Each of the past three decades has been significantly warmer than all the previous decades in the instrumental record, and the first decade of the 21st century has been the warmest. The global combined land and ocean surface temperature data show an increase of about 0.89°C (0.69°C–1.08°C) over the period 1901 - 2012 and about 0.72°C (0.49°C–0.89°C) over the period 1951–2012 when described by a linear trend.
Despite the robust multi-decadal timescale warming, there exists substantial multi-annual variability in the rate of warming with several periods exhibiting almost no linear trend including the warming hiatus since 1998. The rate of warming over 1998–2012 (0.05°C [–0.05 to +0.15] per decade) is smaller than the trend since 1951 (0.12°C [0.08 to 0.14] per decade). Several independently analyzed data records of global and regional Land-Surface Air Temperature (LSAT) obtained from station observations are in broad agreement that LSAT has increased. Sea Surface Temperatures (SSTs) have also increased. Intercomparisons of new SST data records obtained by different measurement methods, including satellite data, have resulted in better understanding of uncertainties and biases in the records. [2.4.1, 2.4.2, 2.4.3, Box 9.2]
It is unlikely that any uncorrected urban heat-island effects and land use change effects have raised the estimated centennial globally averaged LSAT trends by more than 10% of the reported trend. This is an average value; in some regions with rapid development, urban heat island and land use change impacts onregional trends may be substantially larger. [2.4.1.3
Table 2.4: Trend estimates and 90% confidence intervals (Box 2.2) for LSAT global average values over five common periods.
Trends in °C per decade
Dataset
1880–2012 1901–2012 1901–1950 1951–2012 1979–2012
CRUTEM4.1.1.0 (Jones et al., 2012)
0.086 ± 0.015 0.095 ± 0.020 0.097 ± 0.029 0.175 ± 0.037 0.254 ± 0.050
GHCNv3.2.0 (Lawrimore et al., 2011)
0.094 ± 0.016 0.107 ± 0.020 0.100 ± 0.033 0.197 ± 0.031 0.273 ± 0.047
GISS (Hansen et al., 2010)
0.095 ± 0.015 0.099 ± 0.020 0.098 ± 0.032 0.188 ± 0.032 0.267 ± 0.054
Berkeley (Rohde et al., 2013)
0.094 ± 0.013 0.101 ± 0.017 0.111 ± 0.034 0.175 ± 0.029 0.254 ± 0.049
Les chiffres prennent bien soin d’englober la période 79-98 qui est porteuse de l’essentielle du réchauffement récent.
Il n’y a nulle part les chiffres des dernières années. La mention que la dernière décennie est la plus chaude mériterait précision. Toujours est-il que malgré la présence de plus de CO2, l’accroissement de température a baissé (de 0,12 à 0,05 K/décade).
Based upon multiple independent analyses of measurements from radiosondes and satellite sensors it is virtually certain that globally the troposphere has warmed and the stratosphere has cooled since the mid-20th century. Despite unanimous agreement on the sign of the trends, substantial disagreement exists among available estimates as to the rate of temperature changes, particularly outside the Northern Hemisphere extra-tropical troposphere, which has been well sampled by radiosondes. Hence there is only medium confidence in the rate of change and its vertical structure in the Northern Hemisphere extra-tropical troposphere and low confidence elsewhere. [2.4.4]
Etonnant que la stratosphère se refroidisse selon le modèle de l’effet de serre « brut ».
Confidence in precipitation change averaged over global land areas is low prior to 1950 and medium afterwards because of insufficient data, particularly in the earlier part of the record. Available globally incomplete records show mixed and nonsignificant long-term trends in reported global mean changes.
Further, when virtually all the land area is filled in using a reconstruction method, the resulting time series shows little change in land-based precipitation since 1900. Northern Hemisphere mid-latitude land areas do show a likely overall increase in precipitation (medium confidence prior to 1950, but high confidence afterwards). [2.5.1.1]
Comme quoi, ceux qui assène qu’il pleuvra plus (qui sont souvent les mêmes que ceux qui disent qu’il fera plus sec) affirment cela sans que cela ne soit constaté dans le passé.
Confidence is low for a global-scale observed trend in drought or dryness (lack of rainfall) since the middle of the 20th century, due to lack of direct observations, methodological uncertainties and geographical inconsistencies in the trends. Based on updated studies, AR4 conclusions regarding global increasing trends in drought since the 1970s were probably overstated. However, this masks important regional changes: the frequency and intensity of drought has likely increased in the Mediterranean and West Africa and likely decreased in central North America and north-west Australia since 1950. [2.6.2.2]
Globalement pas d’évolution en termes de sècheresse.
Confidence remains low for long-term (centennial) changes in tropical cyclone activity, after accounting for past changes in observing capabilities. However, it is virtually certain that the frequency and intensity of the strongest tropical cyclones in the North Atlantic has increased since the 1970s. [2.6.3]
P 163 : In summary, this assessment does not revise the SREX conclusion of low confidence that any reported longterm (centennial) increases in tropical cyclone activity are robust, after accounting for past changes in Final Draft (7 June 2013) Chapter 2 IPCC WGI Fifth Assessment Report observing capabilities. More recent assessments indicate that it is unlikely that annual numbers of tropical storms, hurricanes and major hurricanes counts have increased over the past 100 years in the North Atlantic
basin. Evidence however is for a virtually certain increase in the frequency and intensity of the strongest tropical cyclones since the 1970s in that region
Pas plus de cyclones. Mais des cyclones plus violents en Atlantique Nord.
Confidence in large scale trends in storminess or storminess proxies over the last century is low due to inconsistencies between studies or lack of long-term data in some parts of the world (particularly in the Southern Hemisphere). [2.6.4]
Pas d’évolution claire sur les tempêtes
Because of insufficient studies and data quality issues confidence is also low for trends in small-scale severe weather events such as hail or thunderstorms. [2.6.2.2]
Pas d’évolution claire sur les orages.
P57 : In summary, there continues to be a lack of evidence and thus low confidence regarding the sign of trend in the magnitude and/or frequency of floods on a global scale
Pas d’évolution claire sur les inondations


